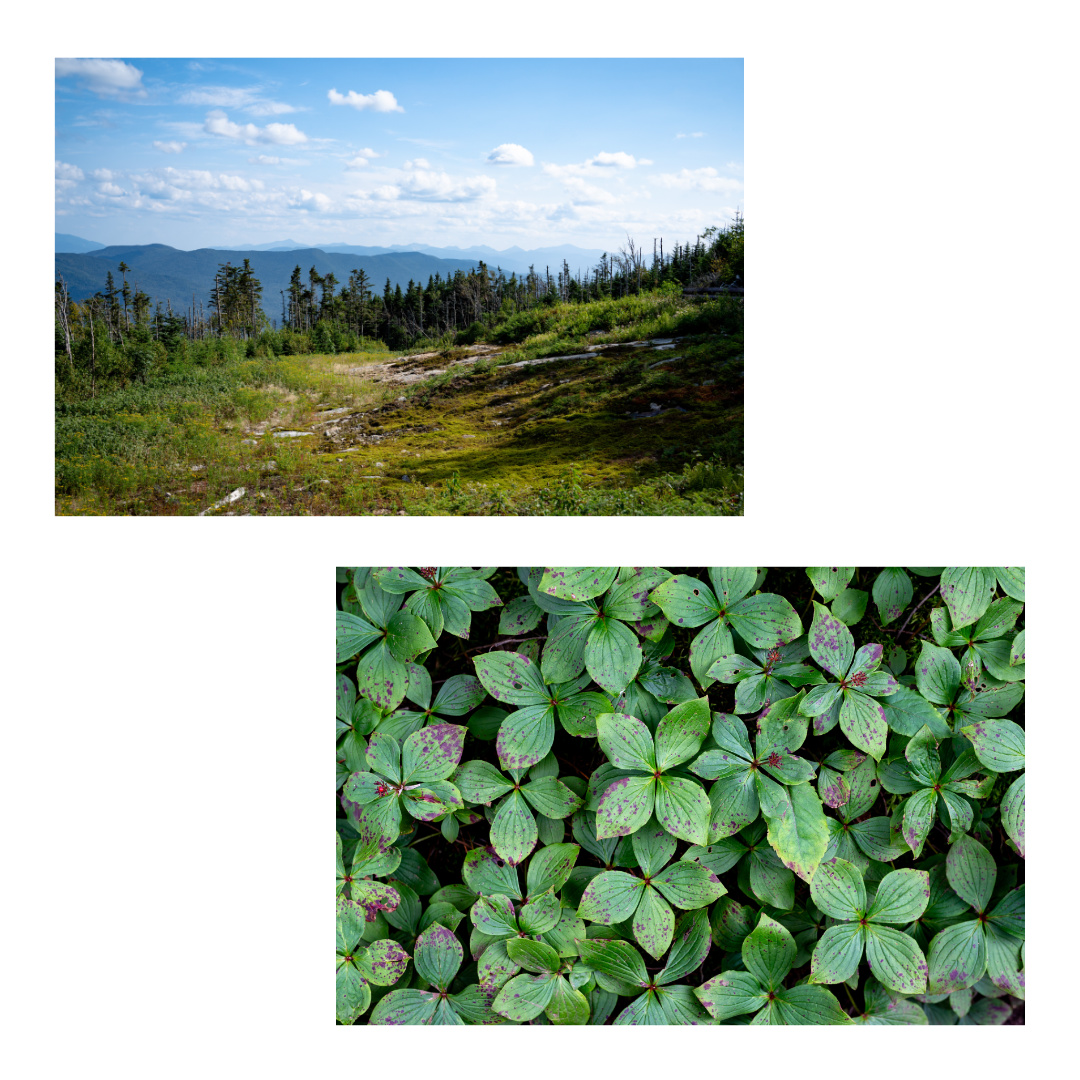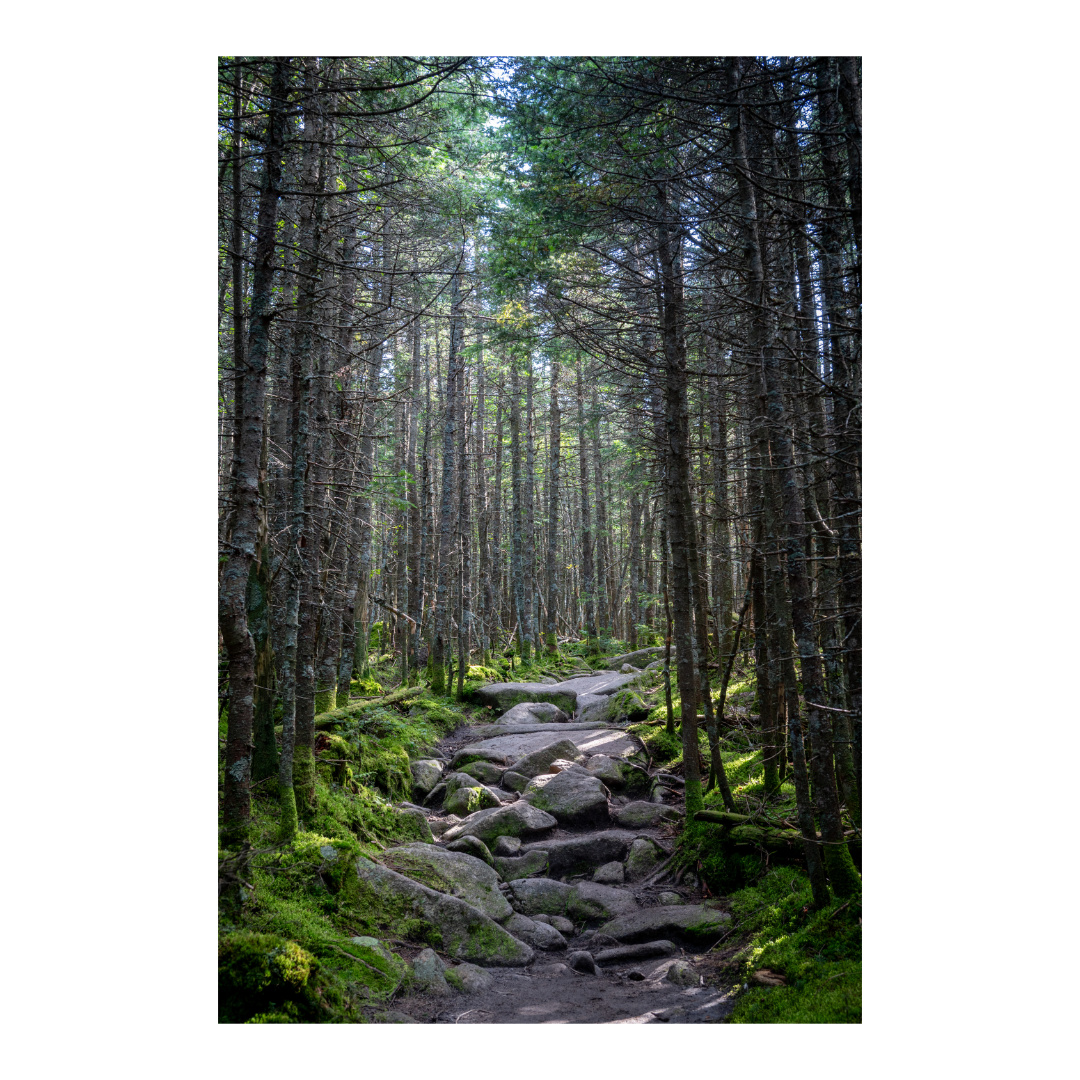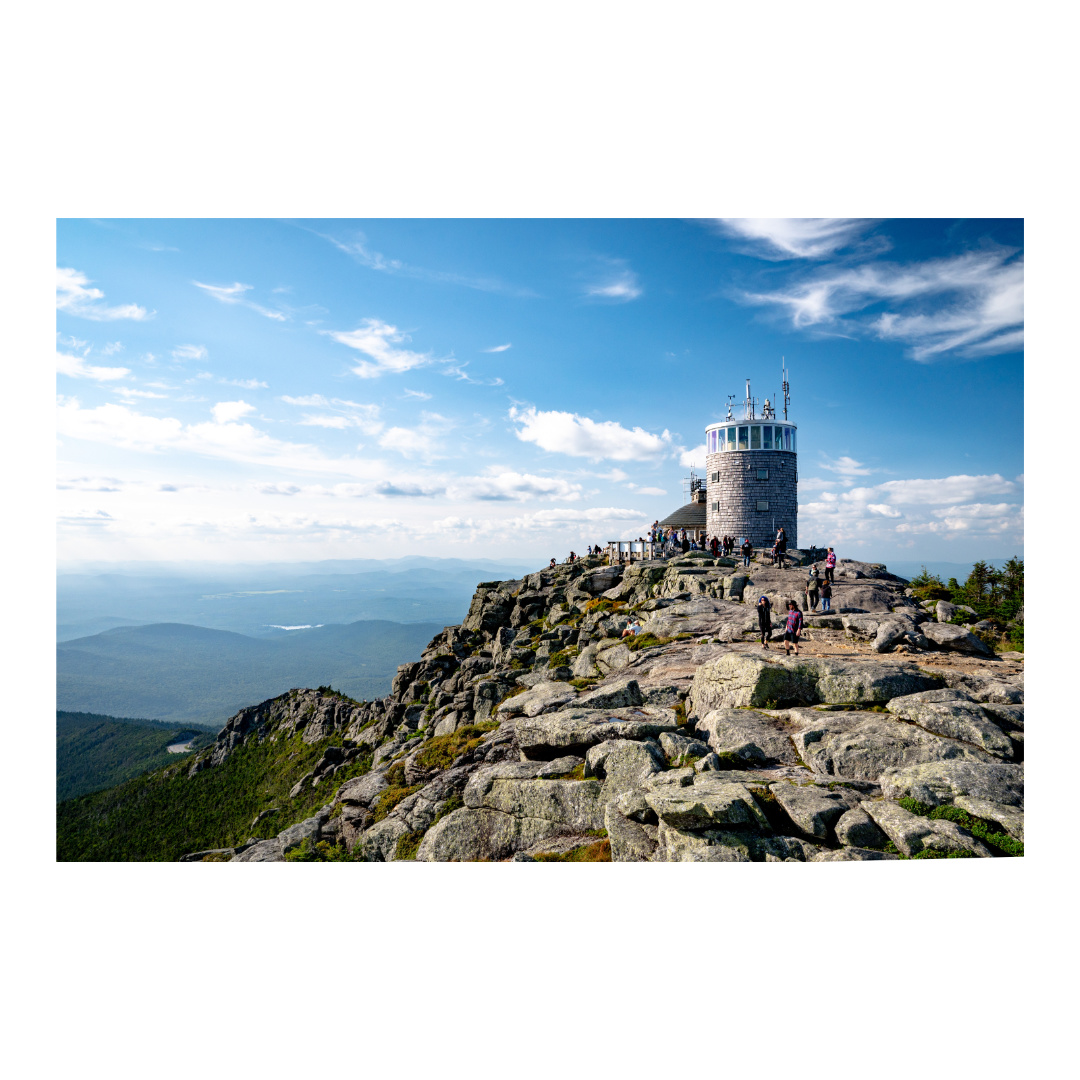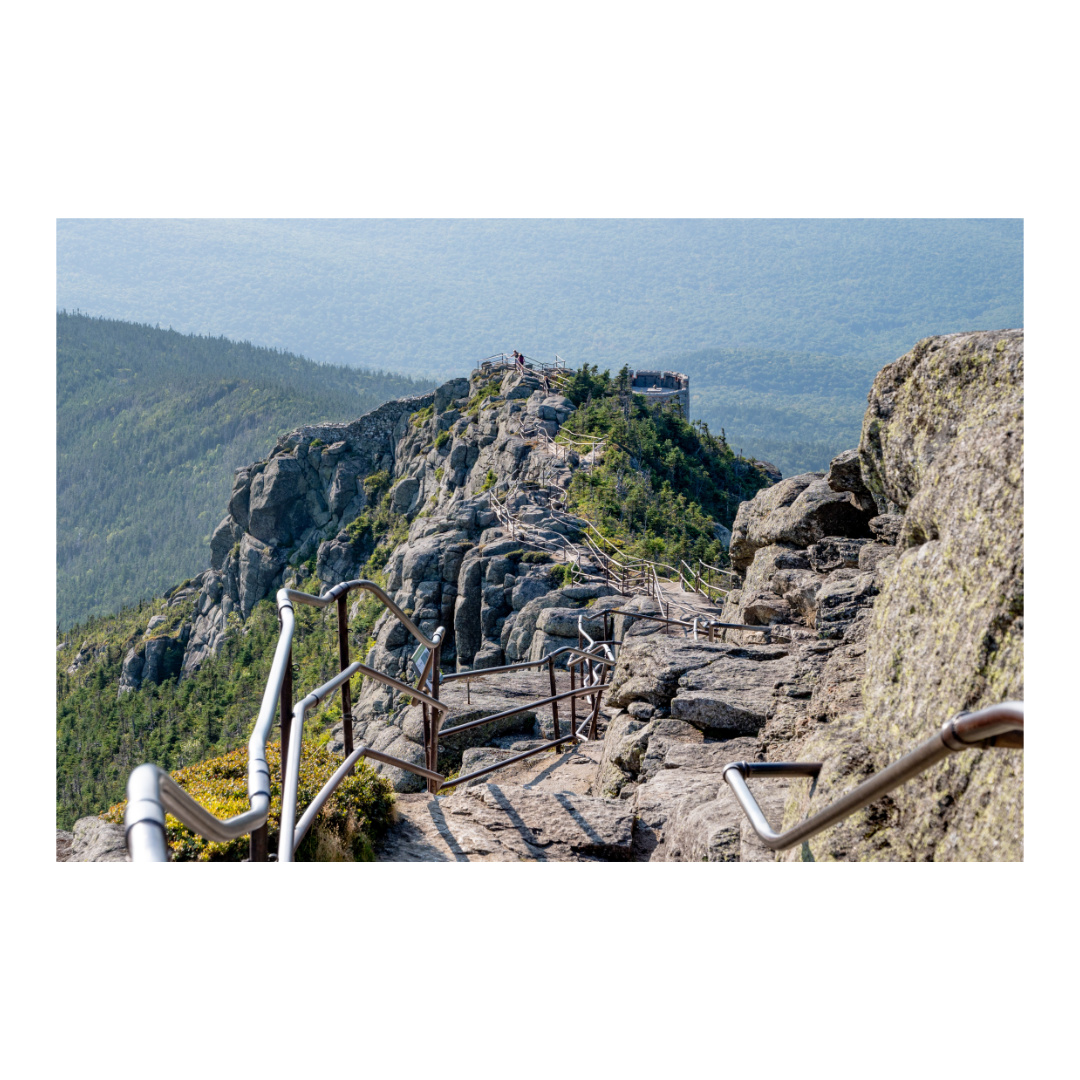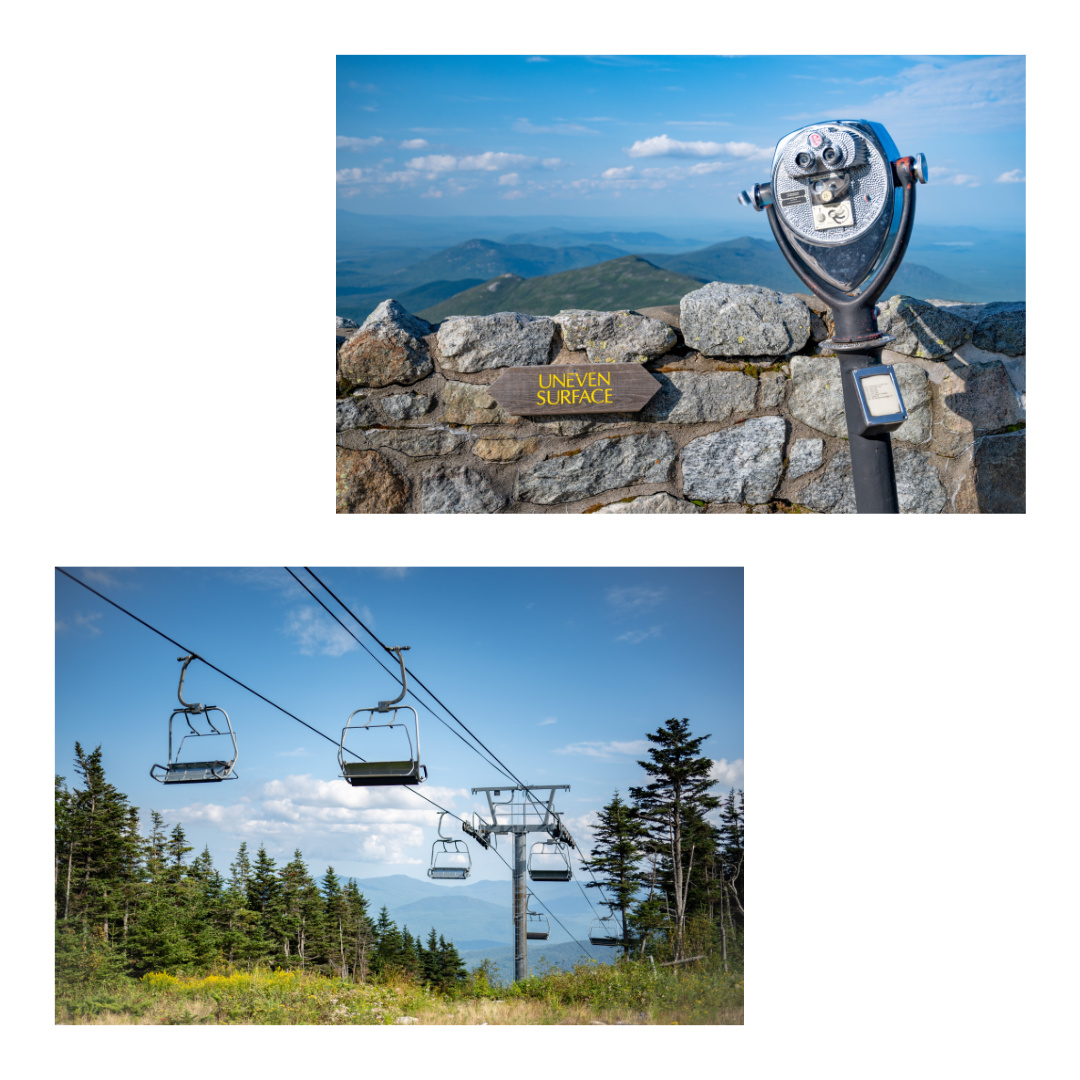
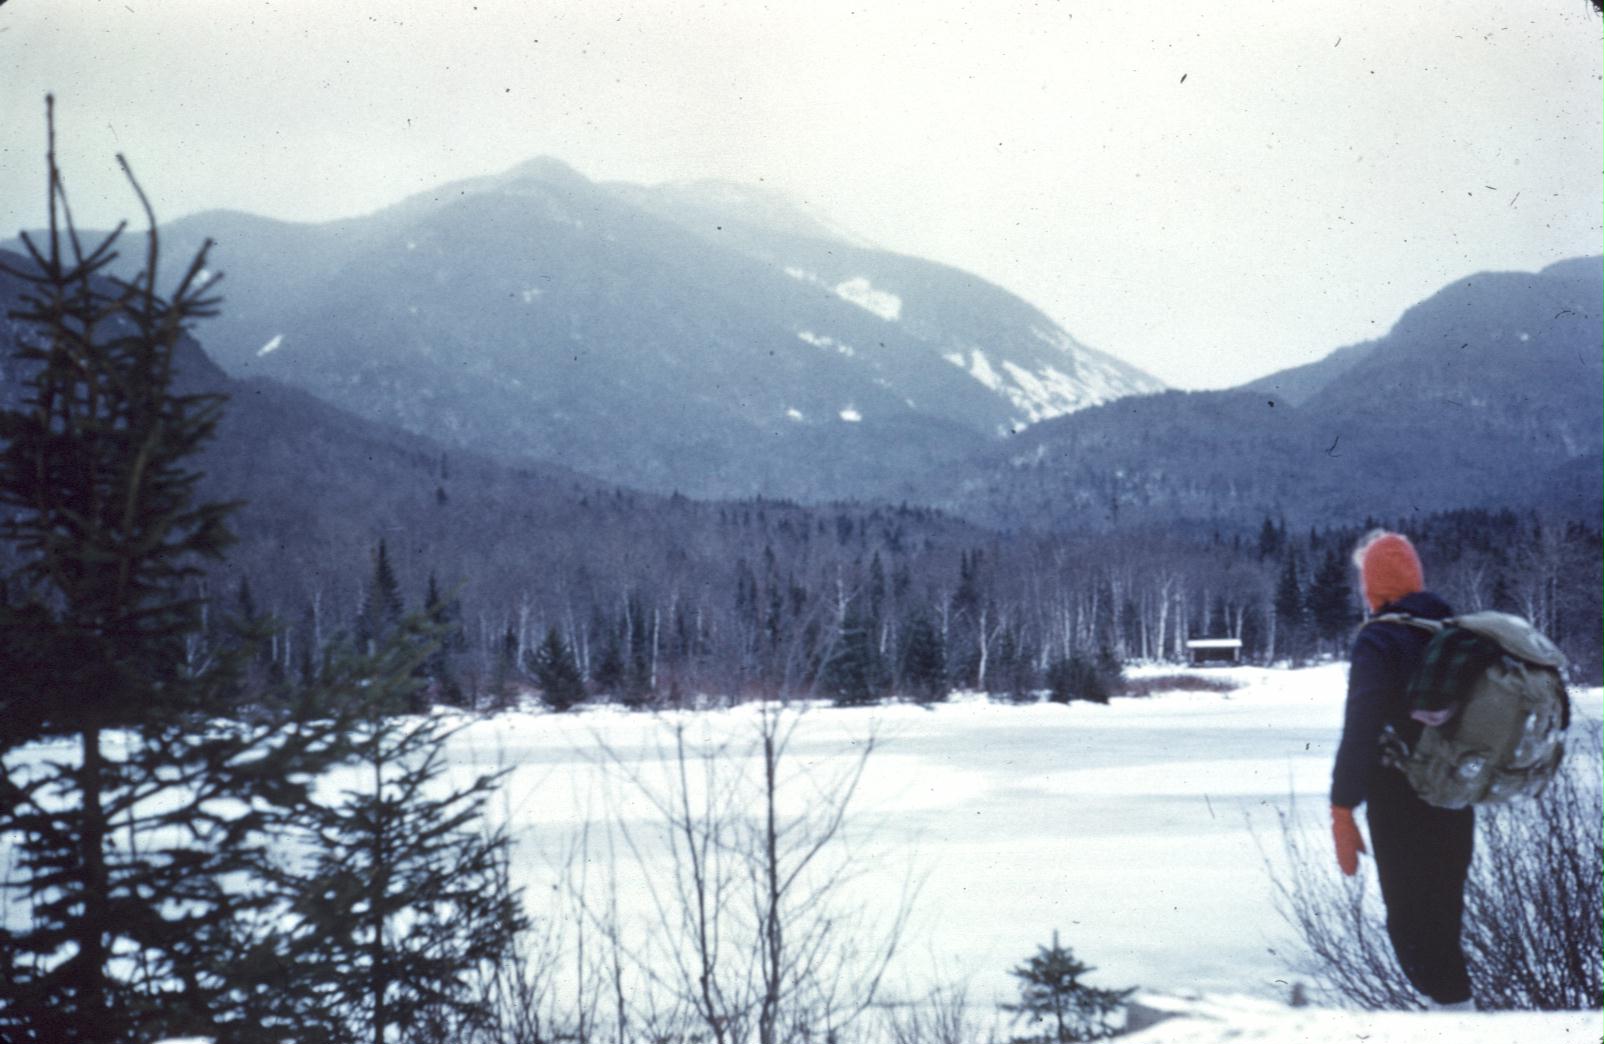
Grandpa hiked Mount Marcy in 1955. After hiking Mount Marcy twice myself I recognized where one of the pictures was taken.
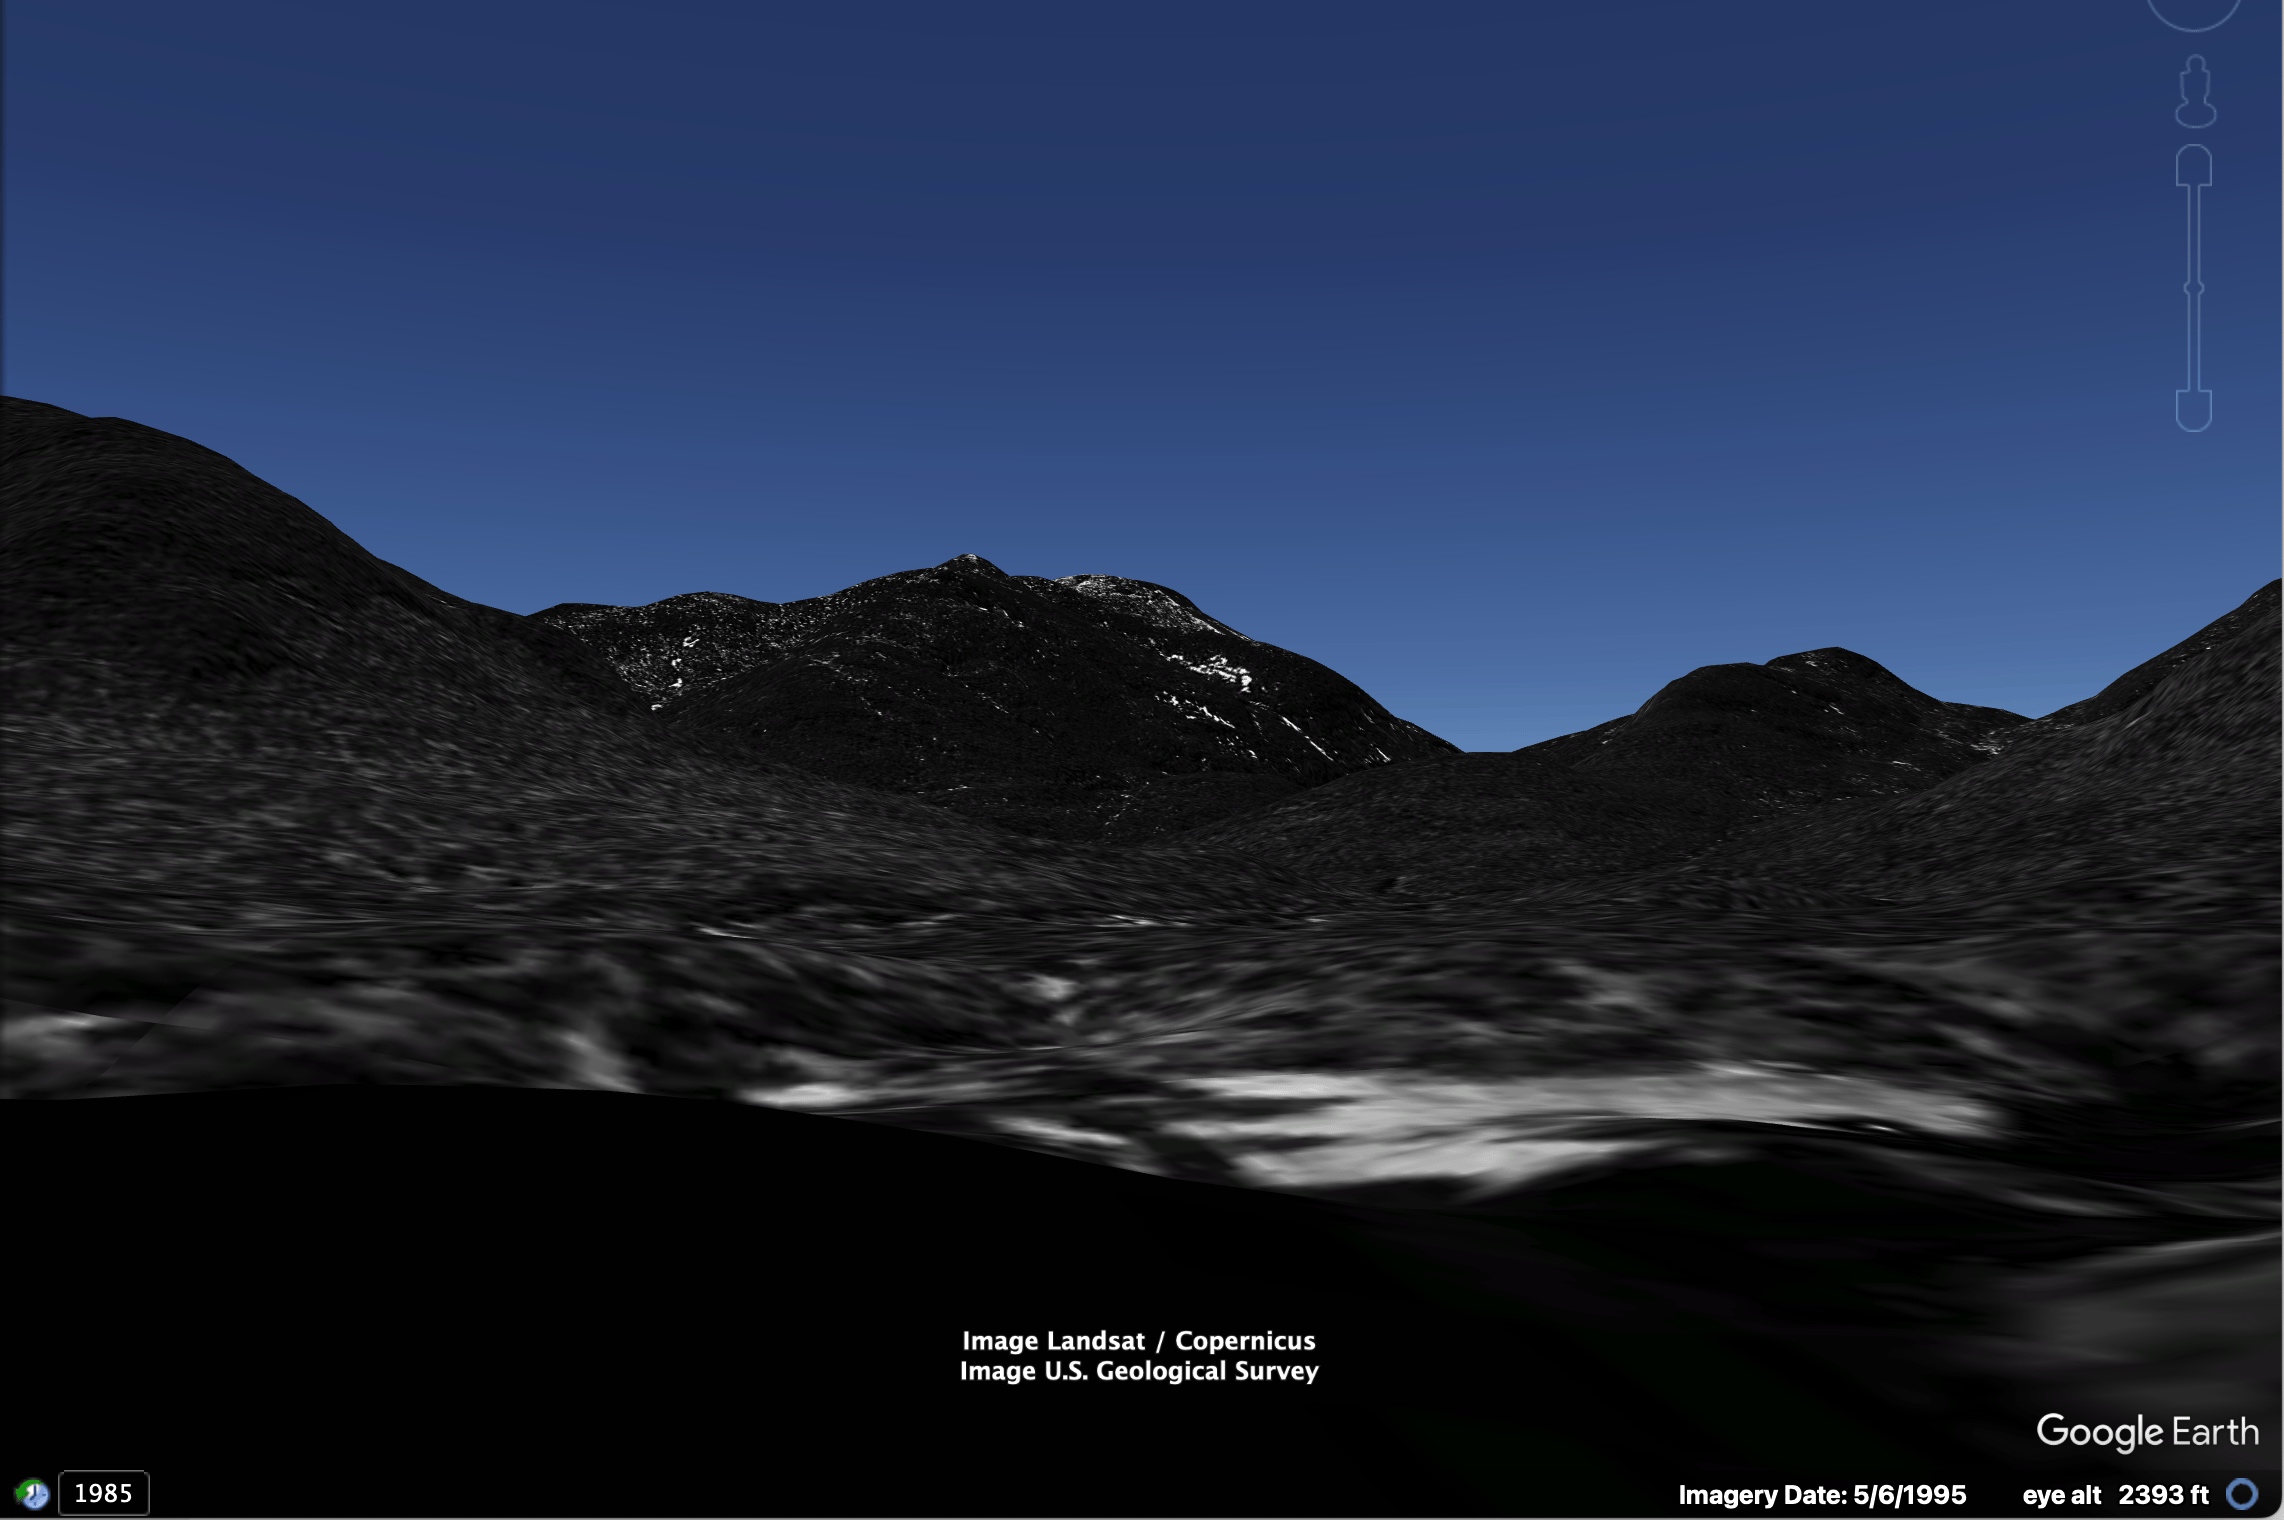
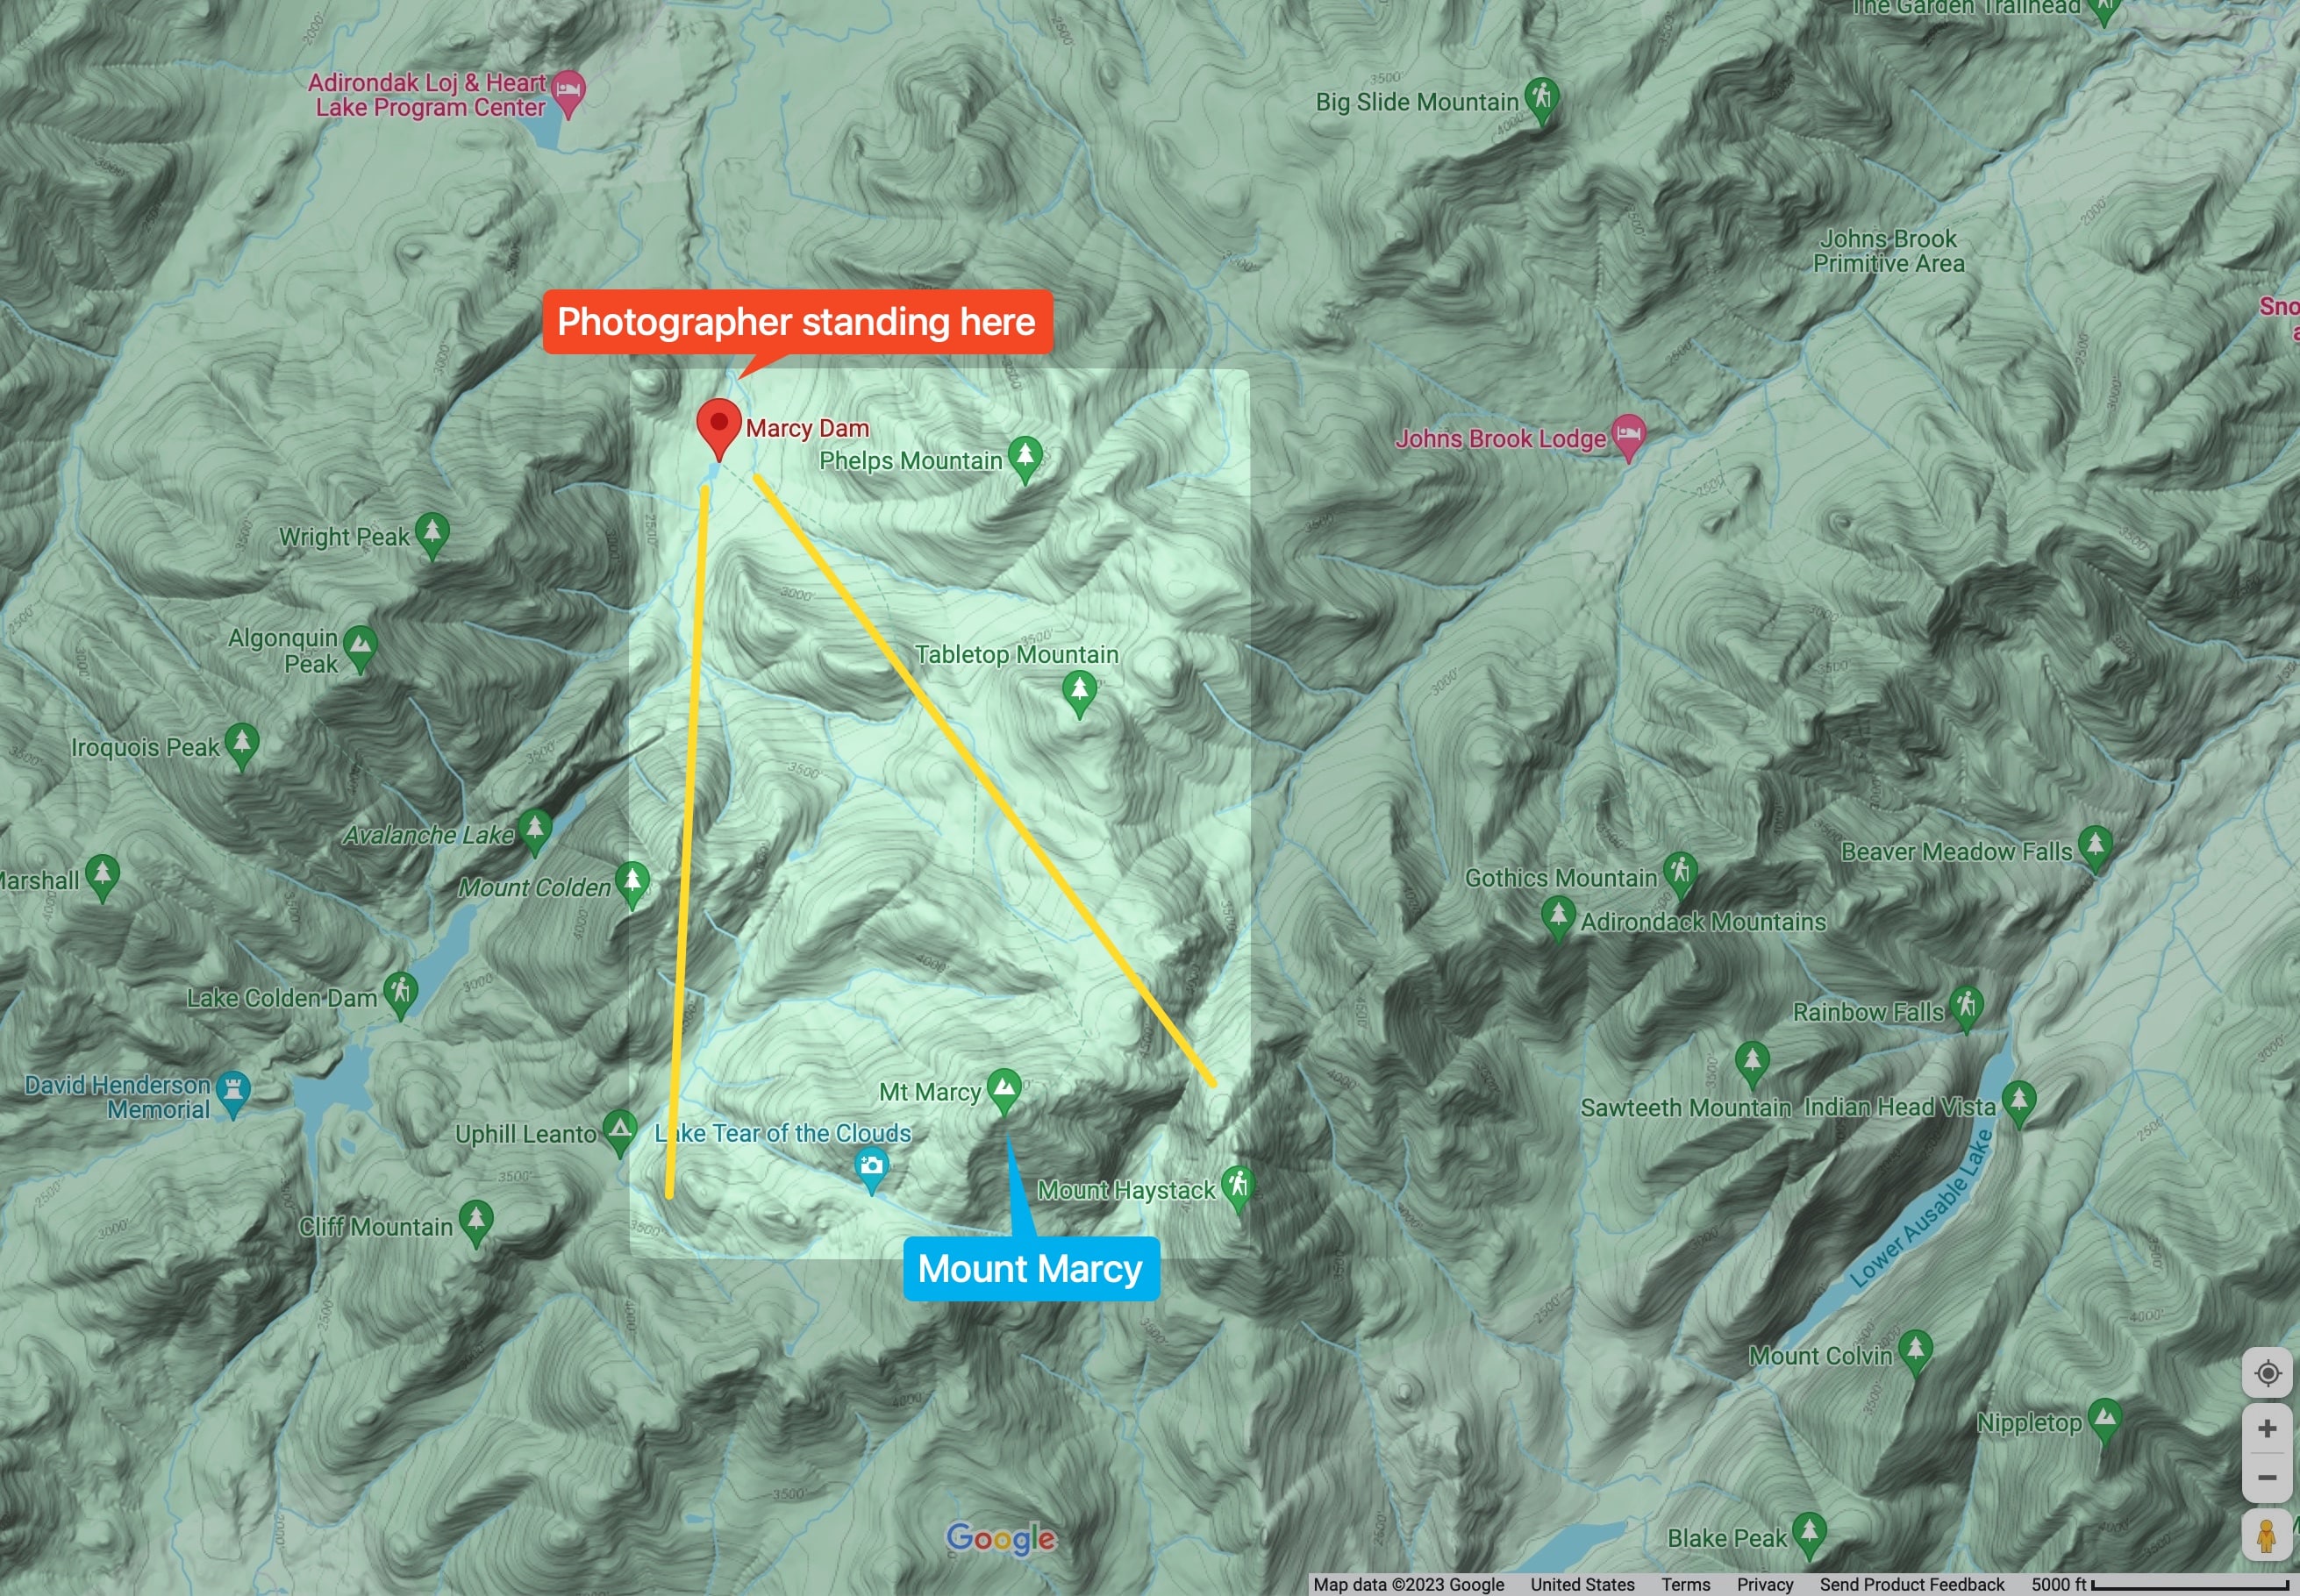
Marcy Dam was damaged by Hurricane Irene in 2011 and the dam has since been removed (Wikipedia).
The same view in 2019:
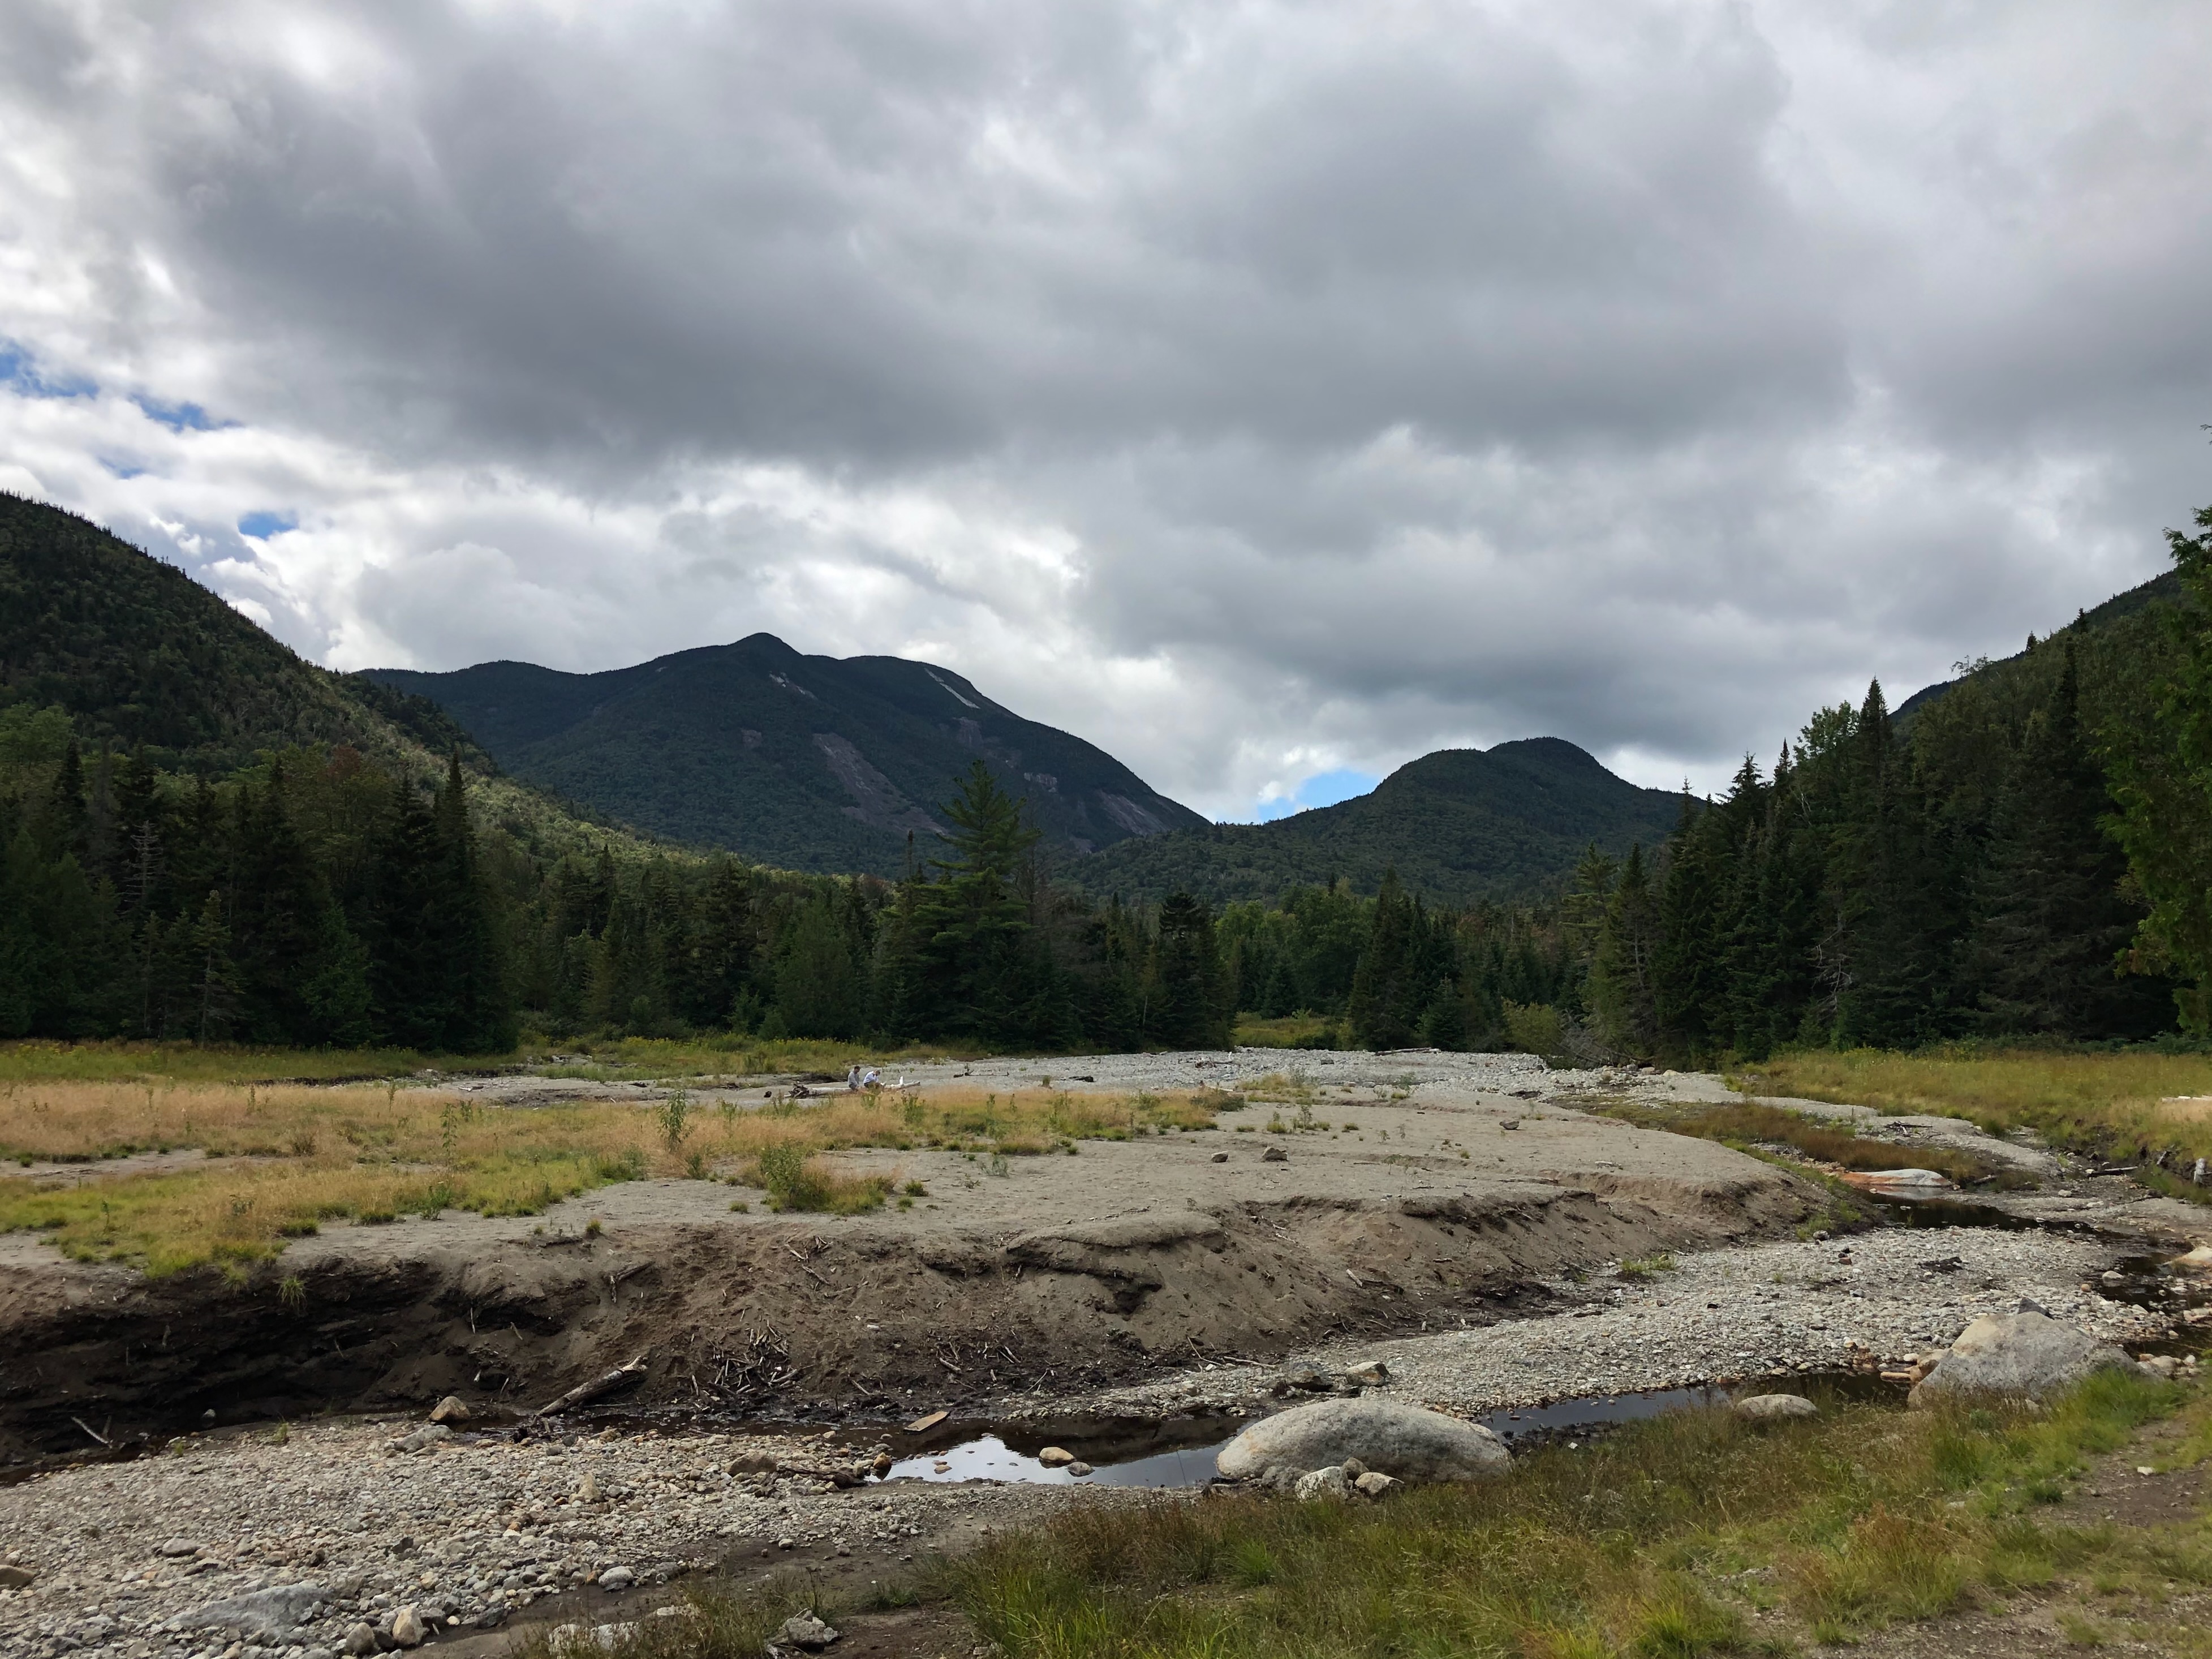
Grandpa hiked Mount Marcy in 1955. After hiking Mount Marcy twice myself I recognized where one of the pictures was taken.


Marcy Dam was damaged by Hurricane Irene in 2011 and the dam has since been removed (Wikipedia).
The same view in 2019:
SSH to server via Tailscale if possible: If Tailscale is not running fall back to a different IP
Requirements:
Replace the following values:
{SERVER_NAME}: These configuration options will be used when you type ssh {SERVER_NAME}
{SERVER_USERNAME}: The username you use to connect to the server
{SERVER_TAILSCALE_IP}: IP Address or DNS name
{SERVER_NON_TAILSCALE_IP}: I said “IP” but “hostname” will also work here
{SERVER_PRIVATE_KEY_FILENAME}: Private key to log in with
# If Tailscale is running connect via this:
Match originalhost {SERVER_NAME} exec "[ $(/Applications/Tailscale.app/Contents/MacOS/Tailscale status --json | jq -r .BackendState) != Stopped ]"
HostName {SERVER_TAILSCALE_IP}
User {SERVER_USERNAME}
IdentityFile ~/.ssh/{SERVER_PRIVATE_KEY_FILENAME}
# If Tailscale is not running connect via this:
Host {SERVER_NAME}
HostName {SERVER_NON_TAILSCALE_IP}
User {SERVER_USERNAME}
IdentityFile ~/.ssh/{SERVER_PRIVATE_KEY_FILENAME}
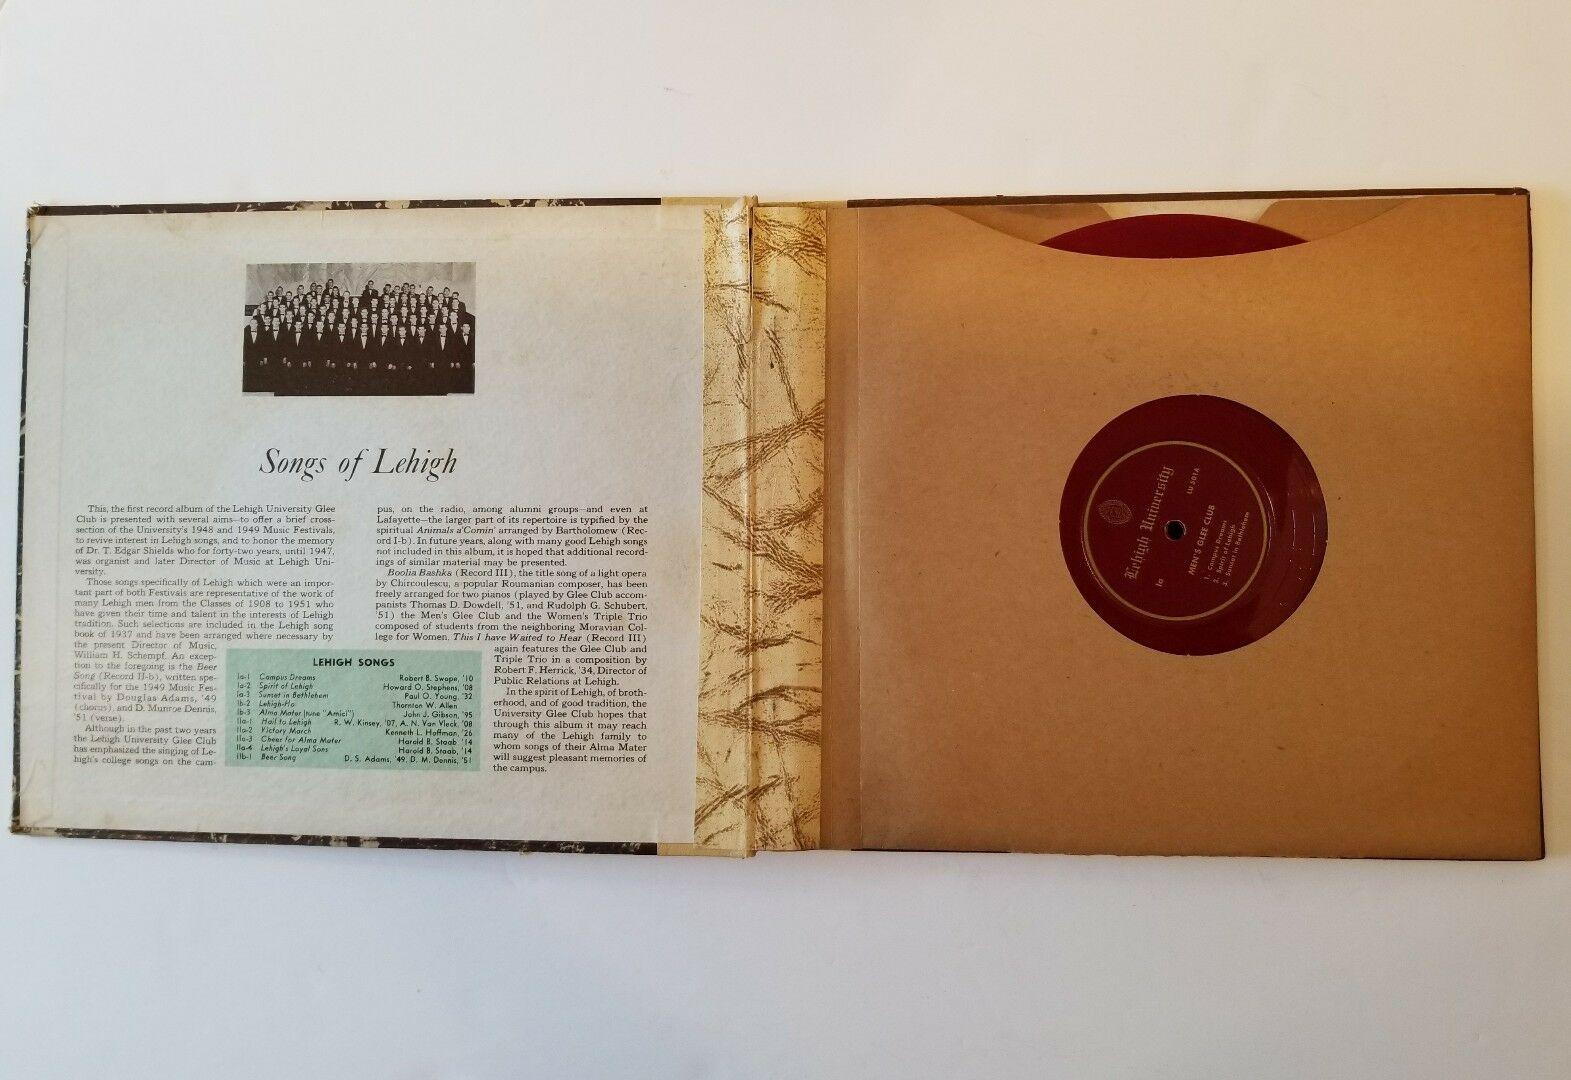
Pops by the Lehigh University Band Another Lehigh vinyl acquired and now available on Archive.org. From discussion in the Marching 97 alumni band Facebook group we’ve learned the following:
This is a part of a series where I digitize vinyl records. More Lehigh records / all records!
Opening Signal Desktop Database on MacOS: I’ve seen some conflicting processes out there, here’s what worked for me in May, 2020:
Download and install DB Browser for SQLite but note that YOU MUST download the version specifically built with SQLCipher support. This version is not obviously available on their website, but you can find it in the nightly build folder here EDIT April 2026: nightlies have moved here
When I tried to open the database with the default version of DB Browser it asked for a key or passphrase but it was never successful in decrypting the database. (This was what you might call infuriating)
You can find those builds here: nightlies.sqlitebrowser.org/latest EDIT April 2026: nightlies have moved here
Open the folder in Finder by pressing Shift + Command ⌘ + g (or open the Window menu and click Go to Folder) and enter the following path:
/Users/{USERNAME}/Library/Application Support/Signal
Open the file config.json in your favorite text editor and copy the value of key, for if you saw the following you would copy A_VERY_LONG_STRING_OF_LETTERS_AND_NUMBERS without the quotation marks.
{
"window": null,
"key": "A_VERY_LONG_STRING_OF_LETTERS_AND_NUMBERS",
"mediaPermissions": true
}
Back in Finder open the folder sql
Open the file db.sqlite (by right clicking on the file and pressing open as, dragging the database to the application, etc.) in your newly installed version of DB Browser for SQLite.
Switch the decryption method from passphrase to raw key in the dropdown menu
Ensure that SQLCipher 4 Defaults is checked. SQLCipher 3 Defaults did not work for me.
Type 0x in the password box and then paste the key you copied from config.json.
0xA_VERY_LONG_STRING_OF_LETTERS_AND_NUMBERSOKYou should be in, the rest is up to you!
A small recipe for combining WTForms and the Quill text editor: I’m using Flask-WTF so this isn’t exactly the same as a pure WTForms implementation, but it should get anyone else on the right track.
The Quill text editor defines its contents as a delta object.
“Don’t be confused by its name Delta—Deltas represents both documents and changes to documents.”
When a user submits the “save changes” button we can use the Quill API to access the contents of the text editor, serialize it with JSON.stringify(), put that string in a WTForm field, which then gets submitted to the backend. In order to keep the form nice and clean we can hide that field from the user.
forms.py
from flask_wtf import FlaskForm
from wtforms import SubmitField, HiddenField, IntegerField
from wtforms.validators import Length, NumberRange
from wtforms.widgets import HiddenInput
class CreatePost(FlaskForm):
delta = HiddenField(
'delta',
validators=[Length(0, 255)],
)
content_length = IntegerField(
label='',
validators=[
NumberRange(2, 255, "Blank posts aren't very interesting.")
],
widget=HiddenInput()
)
submit = SubmitField('Create Post')
template.html
This flask template takes an argument named “form” containing a CreatePost object (defind in the example code above).
{% block page_content %}
<div class="row justify-content-center">
<div class="my-sm-2">
<div class="page-header">
<h1>Read a Post</h1>
</div>
<!-- Create the editor container -->
<div id="editor">
<p>Hello World!</p>
<p>Some initial <strong>bold</strong> text</p>
<p><br></p>
</div>
<!--
Form submission is handled by FlaskWTF. It has a hidden field, which
is updated with the contents of quill.getContents() when the submit
button is pressed
-->
{{ render_form(form) }}
<!-- Include the Quill library -->
<script src="https://cdn.quilljs.com/1.3.6/quill.js"></script>
<script>
// Initialize the Quill editor
var quill = new Quill('#editor', {
theme: 'snow'
});
// When the submit button is pressed, retrieve several pieces of info
// from the QuillJS API (https://quilljs.com/docs/api/#content), copy
// them into to WTForms hidden fields, and submit the form
var submit_entry = function () {
// Get the contents of the text editor
var hidden_text_field = document.getElementById('delta');
hidden_text_field.value = JSON.stringify(quill.getContents());
// Get the length of the contents of the text editor
var hidden_length_field = document.getElementById('length');
hidden_length_field.value = quill.getLength();
}
// Attach the onclick function to the submit button Flask-WTF creates
var new_post_form = document.getElementsByClassName('form')[0];
new_post_form.onsubmit = submit_entry;
</script>
</div>
</div>
{% endblock %}
I finally received my printed circuit boards in the mail, time to assemble them.
This is post number 5 in a series describing my DIY temperature and humidity sensors.
OSH Park’s packaging is not subtle.

The boards are indeed a dark purple, which my camera didn’t properly capture. Here’s what they look like unpopulated and populated:

On the top right there’s a little bit of what I can only assume is someone else’s screen printing that overlapped on to my board. No harm done, and it adds character. The little points that held the panel together during production are rather sharp, I ended up cutting off the points so I wouldn’t stab myself.
It’s not perfect, though. The empty space between components is smaller than it seemed on the computer screen and I didn’t leave enough space between the components. I had to tilt headers connecting to the temperature sensor so it would fit along side the ESP8266.

Despite that, it’s definitely an improvement over the hand-made version.

So where to go from here? I’ve been using this for temperature sensors, but in reality I’ve created a 3.3V based I²C base for the ESP8266. I could replace the temperature sensor with…
But it doesn’t have to be limitted to I²C interfaces!
This is post number 4 in a series describing my DIY temperature and humidity sensors.
For the past month my two prototype sensors have been dutifully reporting the temperature and humidity in my house with any complaint. At this point I want to get a PCB made to make assembly easier. I’ve never done any serious board layout, but learn.sparkfun.com has an well-written, two-part tutorial called Using EAGLE.
This is what I came up with after an evening of work:
I decided to order the boards from OSH Park who are charging me a grand total of $7.35 for three boards (with free shipping!).
These differ from my hand-made prototypes in two ways:
Up to this point all of the sensor’s settings have been hard-coded in the program. If I wanted to change a sensor’s name, it’s recording interval, or the InfluxDB server it reported to I had to change the program and re-flash the ESP8266 with the new version.
This process entails the following:
I made a jig to make this process easier, but it’s a pain, and if you need an FTDI breakout to program this sensor it drives the cost up even more at $15.95 for the FTDI breakout (you could also use an Arduino UNO with the ATMEGA removed, but that’s even more of a pain) and $2.95 for a logic level converter .
This is where the button comes in. If you hold the button down while plugging the sensor in it will enter configuration mode. In this mode the sensor acts as a Wi-Fi hotspot and broadcasts a network called “Sensor Setup”. Navigating to 192.168.4.1 provides configuration options.

These settings are saved in the ESP8266’s flash memory so they persist across power cycles. To leave the configuration mode, simply unplug the sensor and plug it back in again.
“But wait!” you cry, “doesn’t the ESP8266 only have two GPIO pins in this configuration? And you’re using them both for I2C to communicate with the sensor!” And in fact you’re right, only two pins are dedicated to GPIO in this configuration… but the RX and TX pins can be repurposed as GPIO pins. Check out how on Stack Overflow.
The full code can be found on Github
Do you like planes? Do you ever wish you could… track them? This guide will cover setting up your Raspberry Pi as an ADSB feeder and sending the data to various aggregators.
I’m going to be using a Raspberry Pi model 1B+, but the instructions should work for other Raspberry Pi boards and possibily other Debian systems as well.
Let’s start with a clean install of Raspbian Lite. Follow the instructions in the official guide.
Boot it up for the first time and login!
Drop in to the configuration utility with sudo raspi-config and lets go through some defaults to make life better(tm)
Now that we’re back from the reboot, test your network connection! ping 8.8.8.8 It’s OK, Google’s DNS servers can take it.
Time to update and upgrade. While you’re waiting you can read about the difference here
sudo apt-get updatesudo apt-get upgrade-y (which stands for “YES”) to each command like sudo apt-get update -yInstall git with sudo apt-get install git
vim, screen, and sl which displays a steam locomotive everytime you misspell the command ls.The company Flightaware provides free enterprise accounts for anyone who feeds ADSB data to them and also maintains the most recent version of the dump1090 software, so we’ll start with them.
There are two pieces of software you need to know about:
Dump1090 is the software that actually interacts with the RTL-SDR dongle and interprets the ADSB data. The “1090” part of it’s name refers to the frequency 1090 MHz which ADSB runs on. More details about that can be found on the Cincinnati Avionics webpage.
PiAware is FlightAware’s custom software that sends them the data Dump1090 produces, does multilateration (more on that in Step #6 below), and a few other nifty features.
If the planes are reporting their location over ADS-B why does FA need to know the receiver’s location? Planes without ADS-B transponders do not report their location… but FA can estimate their location using multilateration. They have an more in-depth description of the functionality on this webpage 7. That’s it! Congratulations, you are now feeding to FlightAware.
This is post number 3 in a series describing my DIY temperature and humidity sensors.

The sensors themselves are pretty simple, consisting of only five components.
Not including solder, various lengths of wire, and the perf board that the components are mounted on. I used a Sparkfun Snappable Protoboard ($7.95) as the base for each of my sensors.
Total cost before tax: $18.35
Prices given are from Sparkfun as of September, 2018
The goal was a sub-twenty dollar, reasonably accurate temperature sensor that I could place anywhere in my house and forget about.
I want to store this data in InfluxDB (Detailed in Part I) so I can visualize it in Grafana (Detailed in Part II).
My house isn’t wired for Ethernet– if it was I could solve both the transmission and power problems with Power over Ethernet.
In the past I’ve worked with the Nordic NRF24L01+ radios which are reasonabley priced and have decent range, but I would need some sort of relay that could receive the wireless transmission and send it over TCP/IP to the InfluxDB. Someone has done this, but it seems like extra work when I already have a Wi-Fi network in my house.
So I went with the ESP-8266 Wi-Fi module because I had two laying around. Future iterations may use a different version of the chip.
Some impressive work has been done making the ESP8266 run on batteries for a very long time, but batteries eveuntally need charging or changing.
What I do have lying around though, is a bunch of USB wall chargers that can put out 5V and more than enough amperage which, using a LD1117, can be converted from 5V into the 3.3V that the ESP-8266 and sensor need. The ESP-8266 only consumes 170mA tops and the Si7021 sensor uses all of 150 μA, so the LD1117’s max of 800mA is overkill, but hey, I majored in Computer Science and it seems like a good solution to me.
In summary 120V AC power comes out of the wall, gets converted to 5V DC by the USB wall charger, which the sensor is plugged in to. Onboard the circuit board the voltage is dropped again to 3.3V which the radio and the sensor can use.
Right now I’m only using the USB power and ground lines, but I dream of being able to fit some sort of USB Serial Adapter and a logic level converter so that the ESP-8266 can be programmed directly from the USB port. At the moment it’s a bit of a pain to change Wi-Fi networks, I have to remove the ESP8266, and plug it into a jig to reprogram it.
One issue is that a lot of stress can be put on the pins connecting the USB port to the sensor board.
Recording temperature into InfluxDB isn’t very useful if I can’t visualize it. Thanksfully, Grafana exists.
This is part 2 in a series describing my DIY temperature and humidity sensors.
I have Grafana running on the same webserver as this website, configured with two different data sources:
Below is a “snapshot” of the data my temperature sensors collected between Oct 22nd and Oct 29th, 2018. To make it load quickly I’ve set the resolution to 30 minutes (each point on this plot is the average of the past 30 minutes).
Temperature Graph (Direct)
I’m also collecting relative humidity data:
Relative Humidity Graph (Direct)