The Faroes A great photo travelogue by Nagarjuna of their trip. Some of the later pictures of people standing on top of bluffs that appear to go straight down in to the ocean really poke at my fear of heights.
Warning: contains modern James Bond movie spoilers.
NYC $20 Dinner Map (Paywall) I’ve enjoyed Hellgate’s irreverant but thorough coverage of NYC for a while and they finally converted me to a paying member with their current 34% off first-year sale. I really like this map of inexpensive resturants.
Fallback Font Generator(via). This is a tool to help tweak system fonts to match the sizing of your fancy font and reduce Cumulative Layout Shift (CLS) when your fancy font finally loads. Built by Brian Louis Ramirez
Lossless Cut. When I have an hour of video and I need to extract 5 minutes I reach for Lossless Cut instead of Final Cut. It’s a cross platform GUI built on top of ffmpeg. It can merge clips from the same camera in to a single file and extract pieces of a file, both without reencoding. It compliments the commands documented here. I like that I can watch through a video, mark multiple sections for export, and then export them all at once. Since it doesn’t reencode the video it’s much faster than using conventional video editing software.
A few caveats:
On MacOS it can read a file over SMB without issue but I’ve found trying to write to SMB causes issues. Someone else reported the same issue but it seems like its an SMB implmentation issue and they won’t be fixing that.
It often leaves a split second of black frame before and after each extracted clip. Be sure to trim that off before sharing!
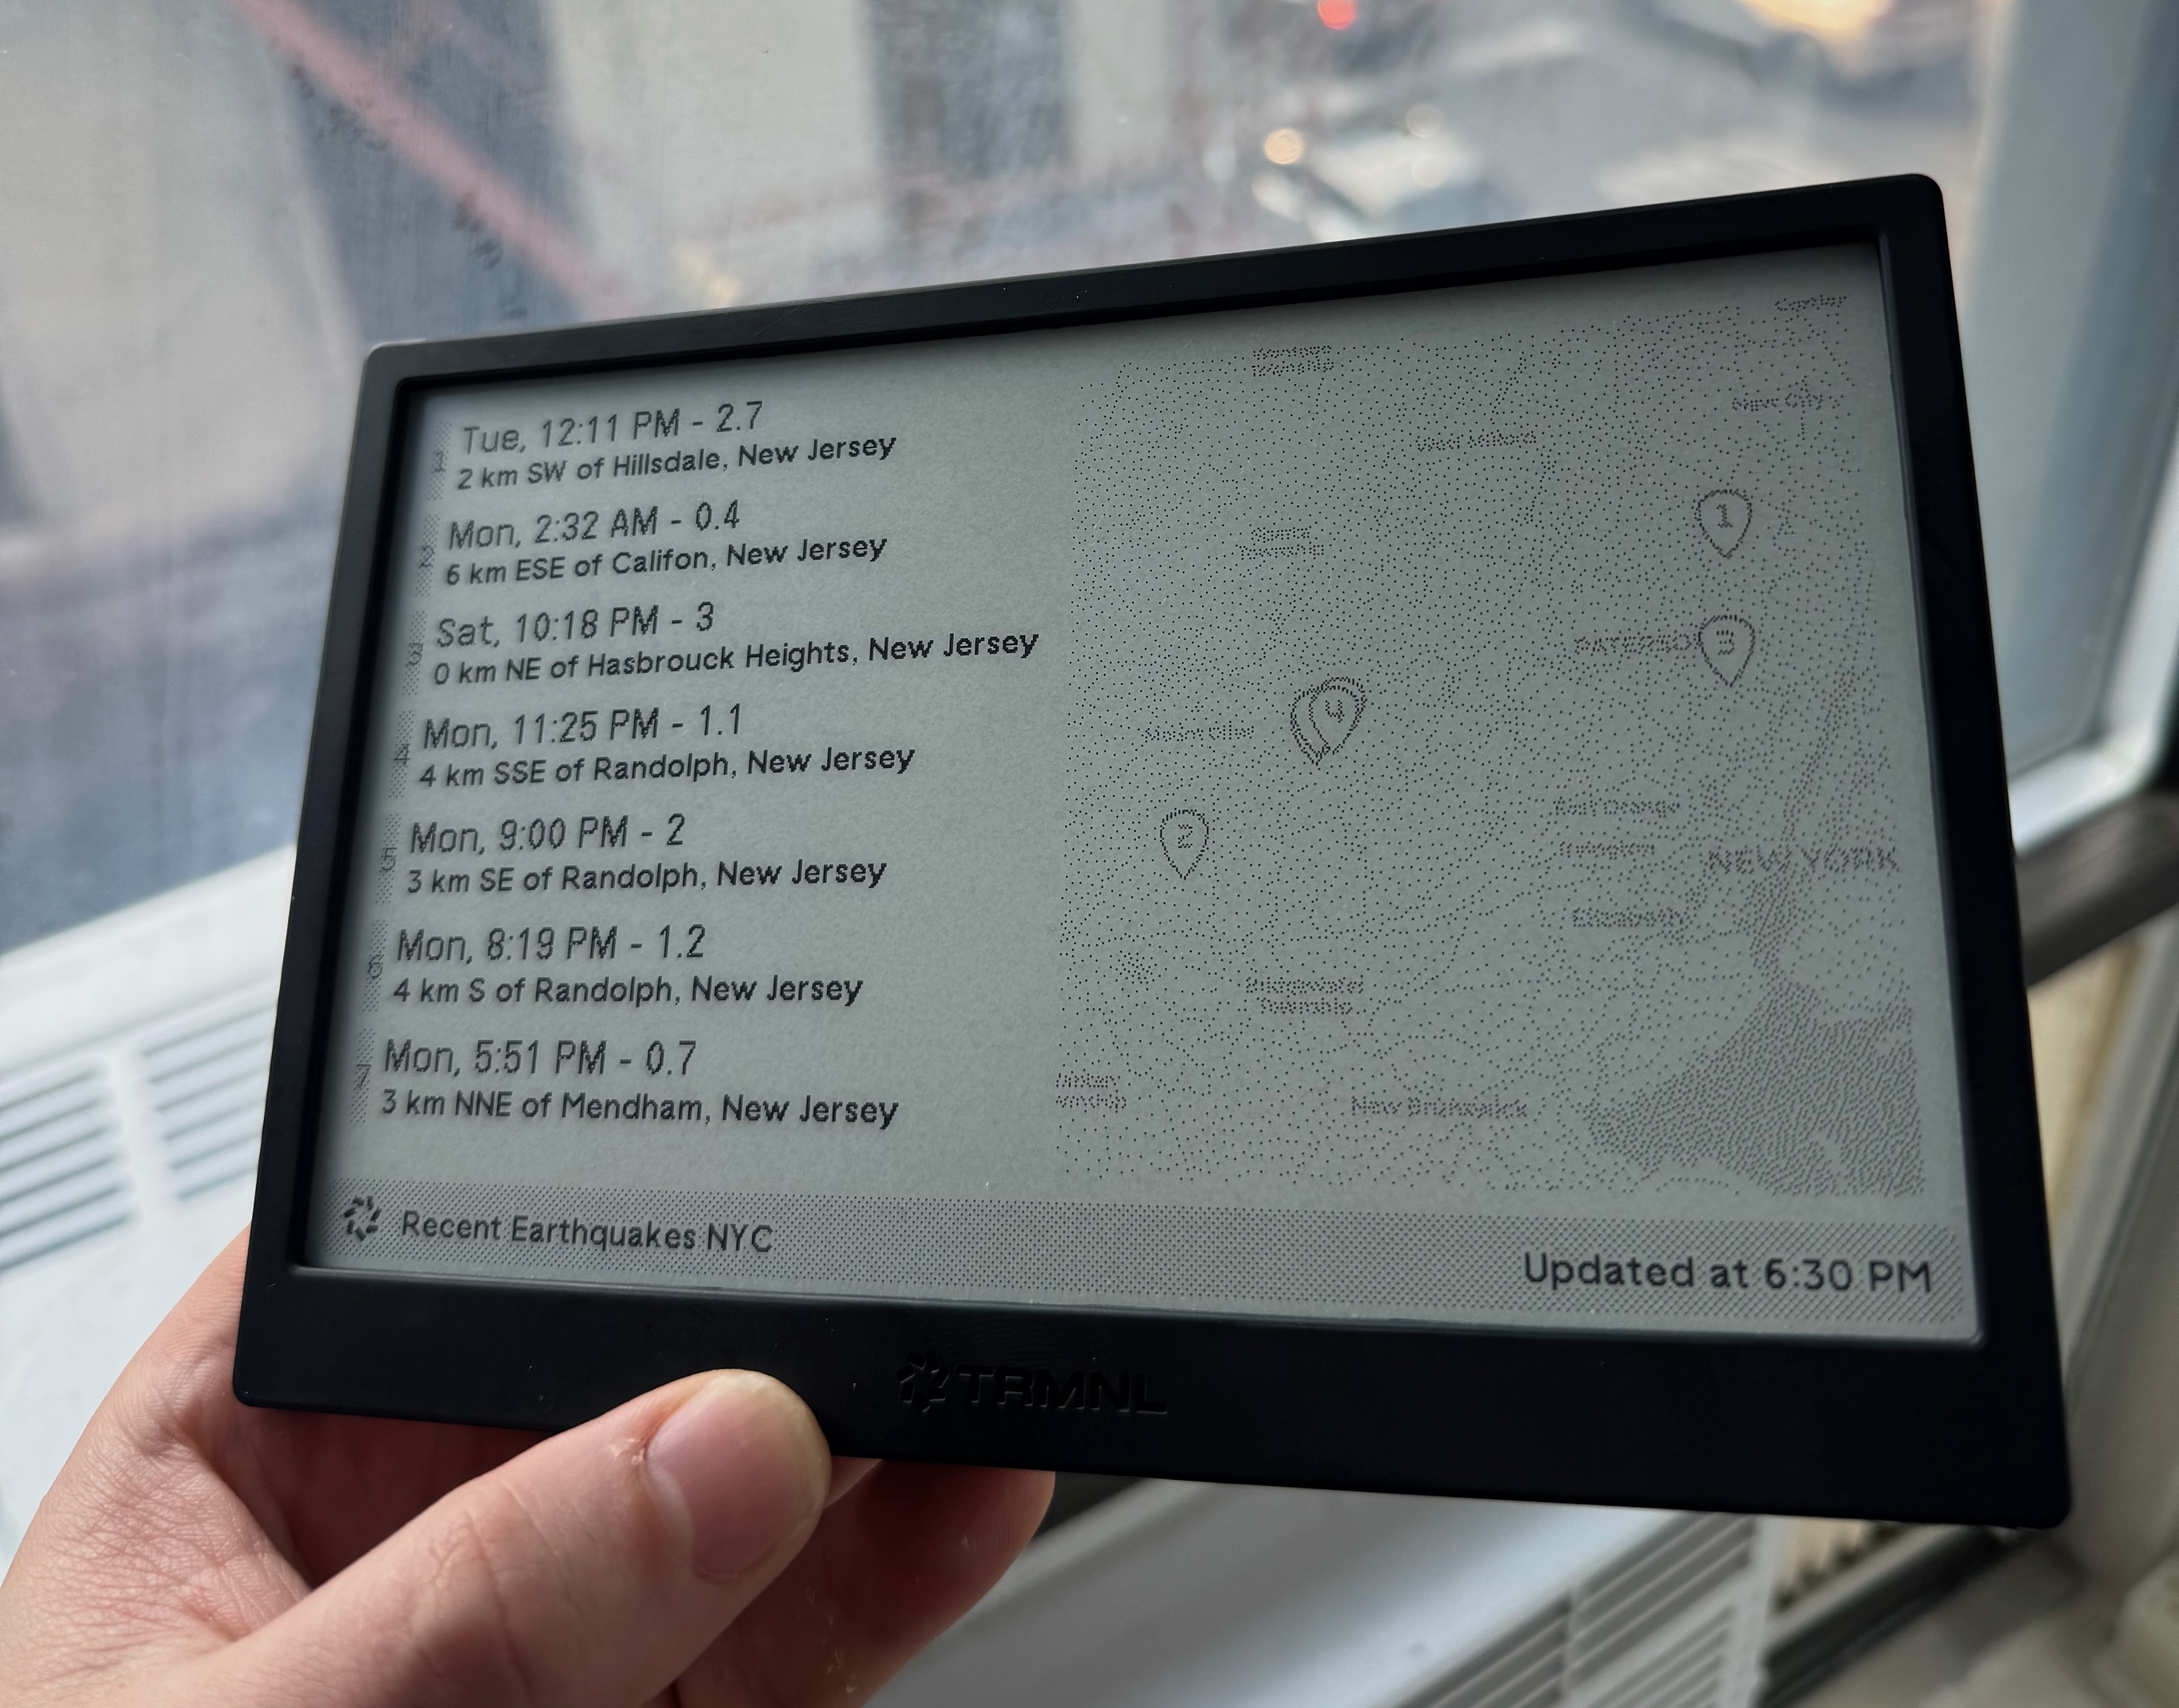
TRMNL Earthquake Recipe I’m having fun building TRMNL recipes! Here’s one that shows recent earthquakes (pulled from USGS’ public API) and plots them on a map.
This is one of several TRMNL plugins I maintain! Find them all under the tag TRMNL
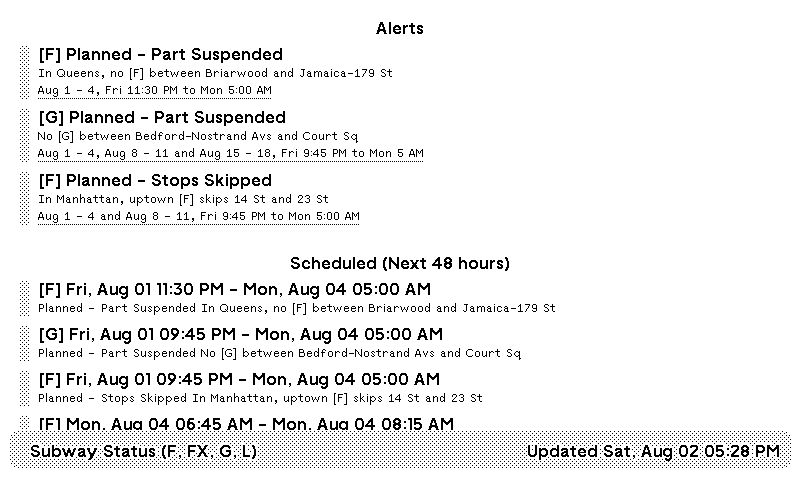
NYC Subway Alerts plugin for TRMNL Trmnl is proving to be the internet connected eink screen I always wanted to build but never wanted to maintain. It lives in my kitchen and predominantely shows my calendar but I decided to try building a recipe of my own. It was pretty easy and I’m pretty happy with the result!
This is one of several TRMNL plugins I maintain! Find them all under the tag TRMNL